Bar Analyzer
v.2.3.4.0

Overview
Measures every bar in ticks and shows how big bars usually are, how big the current one is, and which bars are big - above a threshold worked out from the chart itself. On a big bar with a long rejecting wick, confirmed by the delta and the RSI, it gives a buy or sell signal.
How it works
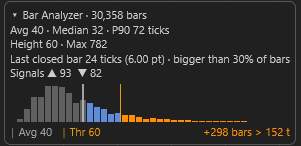
- Each bar's size is a column in the panel: grey - below average, blue - up to the threshold, orange - above it.
- The threshold is the average size of the bars between the average and the largest - or your own Bar height.
- A pattern bar: bigger than the threshold, a long wick against the move, the body at the far end.
- On the next bar the delta and the RSI confirm: ▲ for a buy, ▼ for a sell under / over the pattern bar's column.
Parameters
Parameters
| Parameter | Default | What it does |
|---|---|---|
| Use custom bar height | Off | On: a pattern bar must be taller than Bar height. Off: taller than the threshold from the statistics (the average of the bars between the average and the maximum size). |
| Bar height (ticks) | 75 | The pattern bar's minimum size when Use custom bar height is on. |
| Minimum wick (% of body) | 40 | The rejecting wick must be at least this % of the body. |
| Minimum body (% of bar) | 25 | The body must be at least this % of the bar's size. |
| Rsi up threshold | 60 | A sell needs the RSI at or above this. |
| Rsi down threshold | 40 | A buy needs the RSI at or below this. |
| Strict color | On | On: a buy needs a bearish pattern bar and a sell a bullish one. Off: either colour. |
| Delta | Session cumulative | Session cumulative: the session's cumulative delta above zero for a buy, below for a sell. Bar delta: the confirmation bar's own delta. Off: no delta condition. |
| Rsi period | 14 | The RSI period. |
| Rsi smooth | 3 | The RSI smoothing. |
| Min size (ATR) | 0 | The pattern bar must also be at least this many ATRs tall. 0 = off. |
| Atr period | 14 | The ATR period for Min size (ATR). |
| Delta source | Bars | Bars: the delta estimated from each bar by where it closed in its range - fast, any history. Ticks: the real delta of trades at the bid and ask from a 1-tick series - exact, slow to load. |
| Tick delta type | Bid ask | With Delta source Ticks. BidAsk: a trade at the ask is buying, at the bid selling. UpDownTick: a trade above the previous price is buying, below it selling. |
Visual
| Parameter | Default | What it does |
|---|---|---|
| Color pattern bars | On | Colors the pattern bar on the price chart when it gives a signal. |
| Pattern bar, buy | blue | The price bar's color for a buy pattern. |
| Pattern bar, sell | violet | The price bar's color for a sell pattern. |
| Statistics card | On | The card with the bar statistics in the price chart's top right. |
| Size histogram | On | A small histogram of the bar sizes in the card, with Avg and the threshold marked. |
| Small bars | dim gray | Columns below the average size. |
| Medium bars | cornflower blue | Columns from the average to the threshold. |
| Big bars | dark orange | Columns above the threshold - the size a pattern bar needs. |
| Buy mark | dodger blue | The ▲ under a buy pattern bar. |
| Sell mark | gold | The ▼ over a sell pattern bar. |
| Avg line | silver | The average size line. |
| Threshold line | orange | The threshold (or Bar height) line. |
| Max line | indian red | The maximum size line (shown when it fits the panel). |
| Card background | — | The statistics card's background. |
| Card folded | Off | Only the card's first line. A click on that line on the chart folds / unfolds the card. |
| Card border | — | The statistics card's thin border. |
The statistics card
A card on the price chart (top right) shows the bars analysed, the average, median, 90th percentile, threshold and maximum size, the last closed bar's size and rank, and the signal counts, with a histogram of the sizes. Click its first line to fold it.
Delta source
| Source | The delta |
|---|---|
| Bars (default) | Estimated from each bar by where it closed in its range - fast, any history. |
| Ticks | The real delta of trades at the bid and ask (or up / down ticks) - exact, slower to load. |
For strategies
| Value | Meaning |
|---|---|
| BuySignal / SellSignal | 1 / -1 on the bar after the pattern bar. |
| BarSize | The bar's size in ticks. |
Version history
v.2.3.4.0 - October 2026
- New: bar-size columns, threshold lines, signal marks and a statistics card on the price chart (fold with a click).
- Added: Delta source (Bars / Ticks) and the tick delta type.
- Changed: the threshold also updates in real time; much faster on long histories.