GARCH
v.2.0.0.0
Overview
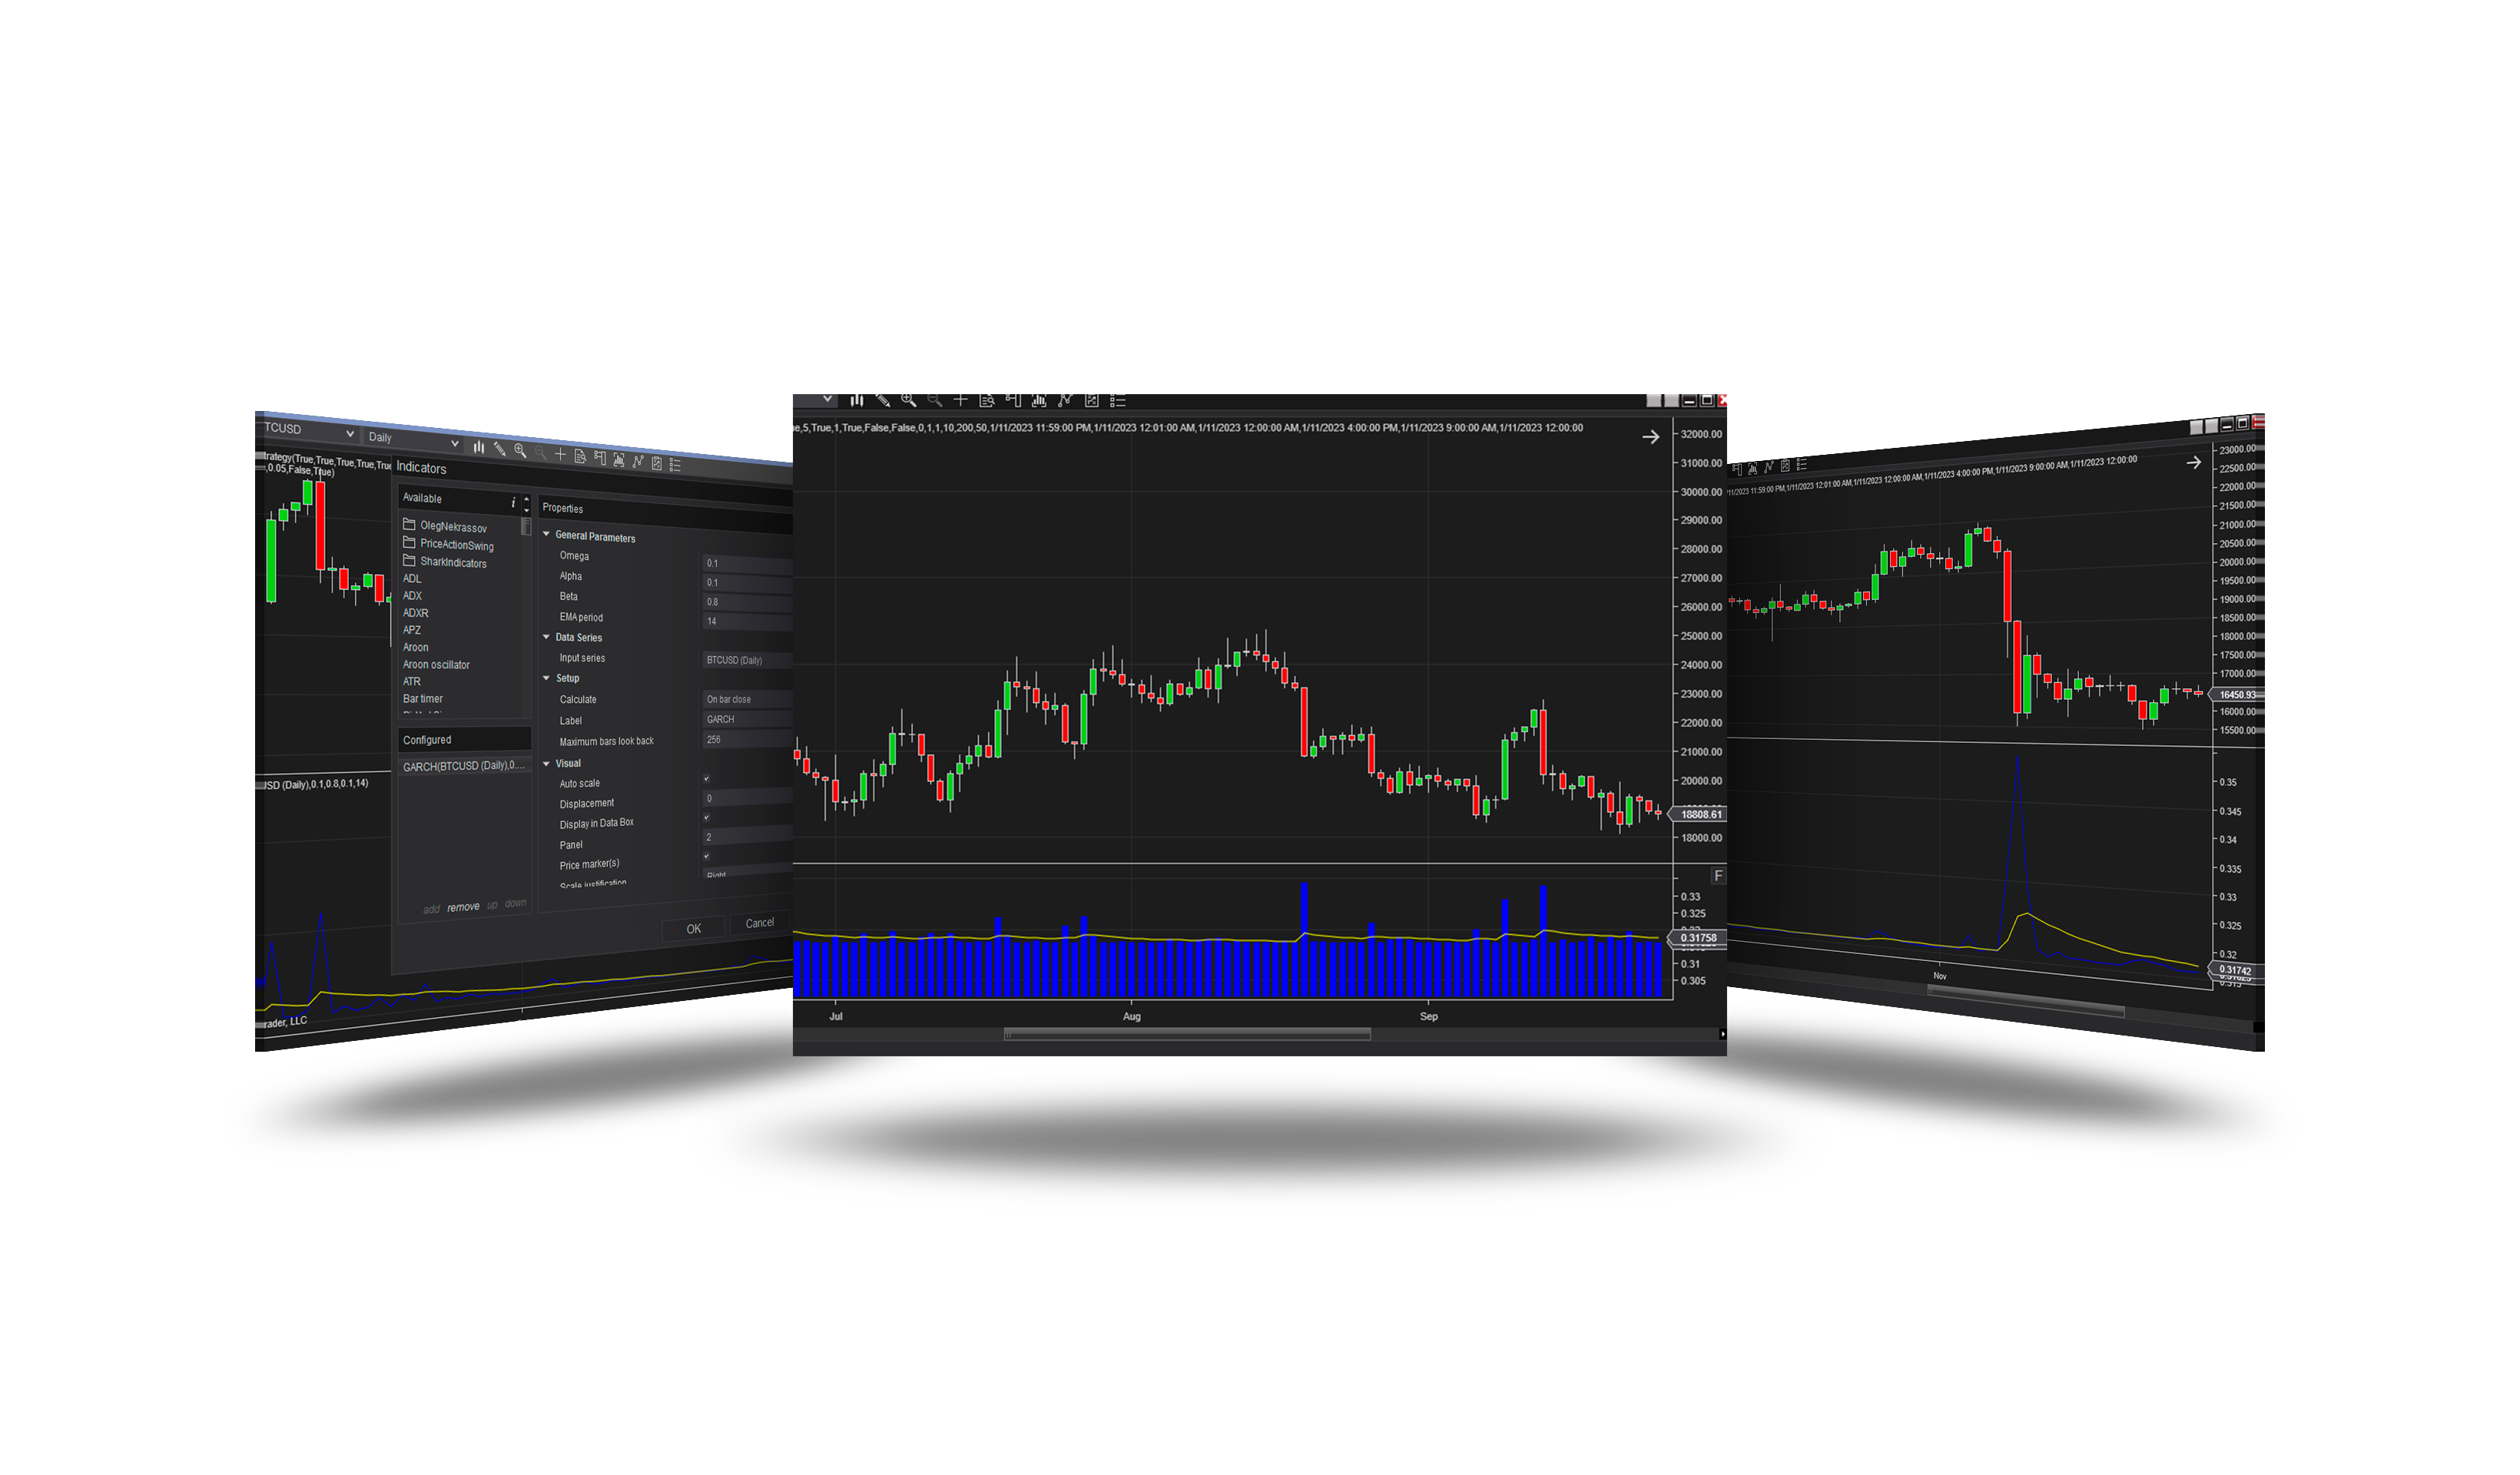
A GARCH(1,1) model of volatility: each bar's variance is the long-term level plus a reaction to the last return plus the persistence of the previous variance. Volatility rises after big moves and fades back, so the line shows when the market is unusually calm or nervous. Shown in % per bar, with its EMA.
Parameters
| Parameter | Default | What it does |
|---|---|---|
| Omega | 0 | The constant of the variance (return units squared). 0 = from the variance of the last EMA period returns (variance targeting). |
| Alpha | 0.1 | α measures the response of volatility to past returns. |
| Beta | 0.8 | β - the degree of persistence of volatility. |
| EMA period | 200 | The EMA of the volatility line, and the window of the long-run variance for Omega 0. |
σ²t = ω + α · r²t-1 + β · σ²t-1
(1,1) in the name: the model looks one bar back - at the last return (α) and at the last variance (β).
With Omega 0 (default) the long-term level is taken from the market itself - the variance of the last EMA period returns.
Version history
v.2.0.0.0 - October 2026
- Fixed: a true GARCH(1,1) - the variance carried from bar to bar; Omega 0 = taken from the market.