Mean Reversion Horizontal
v.1.1.0.0
Overview
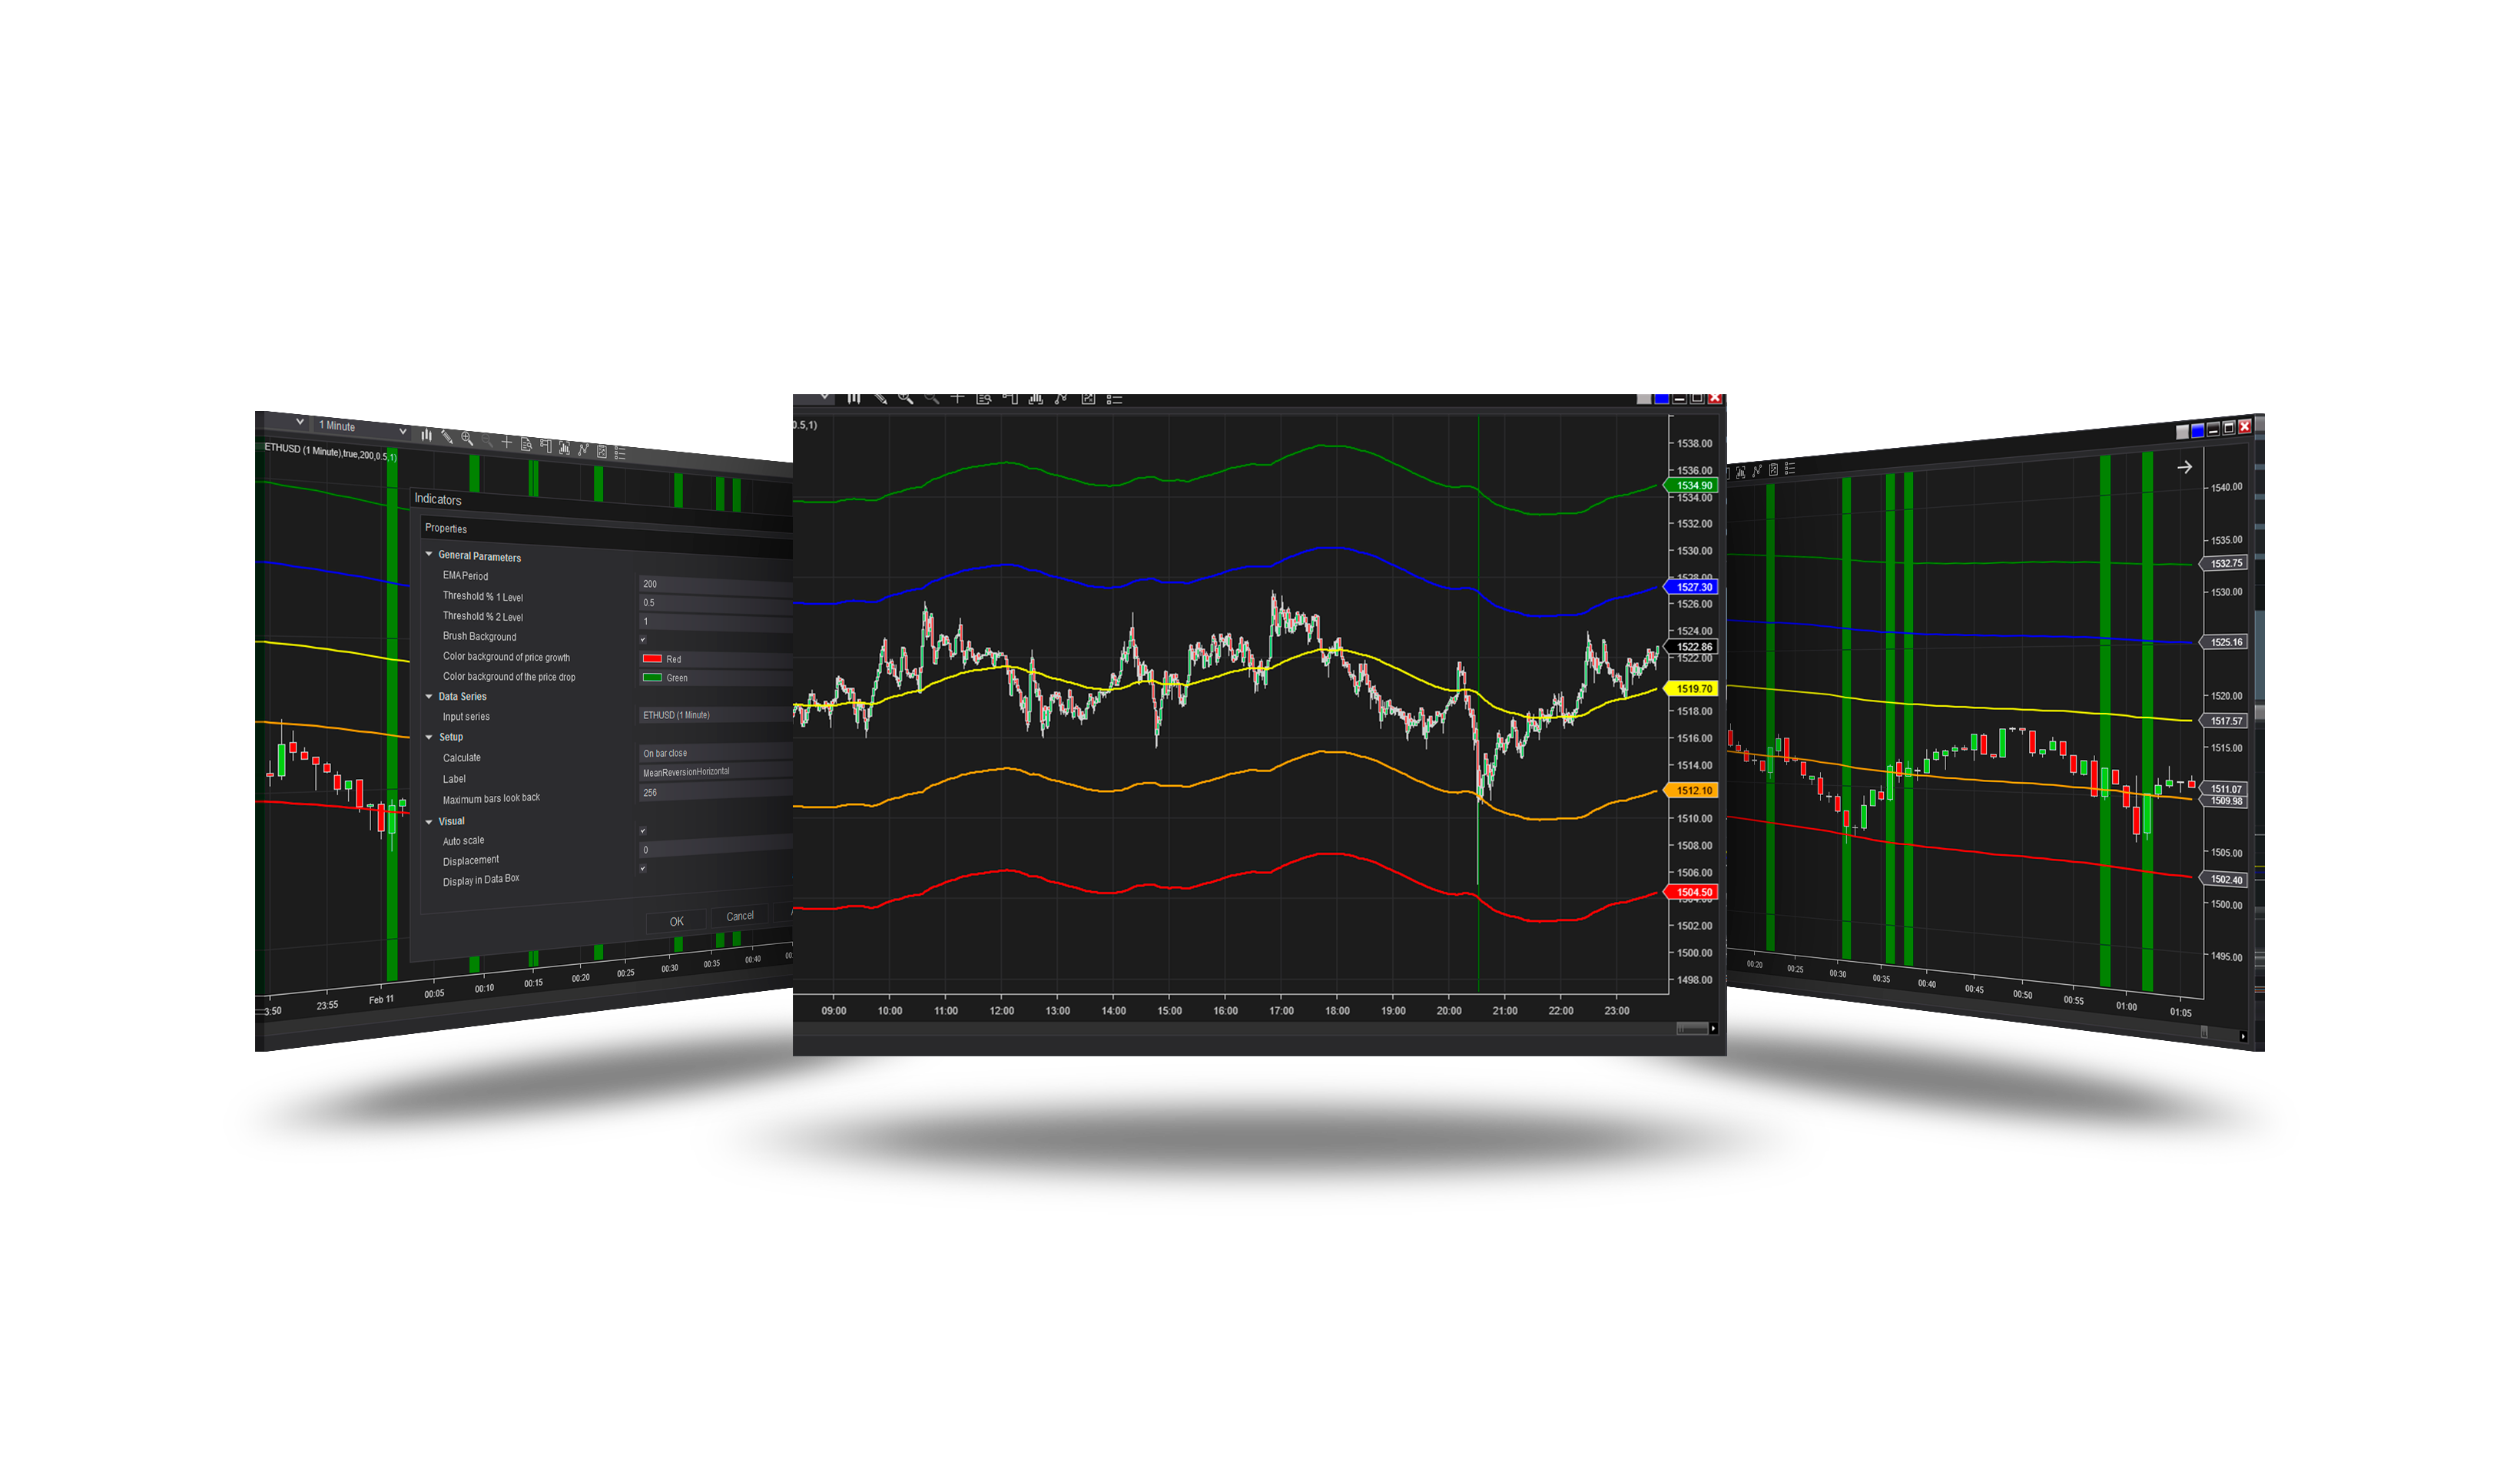
Two percentage bands above and below an EMA. When the price turns at a band - up at a lower band, down at an upper one - the chart's background is highlighted, marking a possible return to the mean.
Parameters
| Parameter | Default | What it does |
|---|---|---|
| EMA Period | 200 | The EMA the bands are set around. |
| Threshold % 1 Level | 0.5 | The inner bands: this % above and below the EMA. |
| Threshold % 2 Level | 1 | The outer bands: this % above and below the EMA. |
| Brush Background | On | Fill in the chart background when the price reaches a drawdown or growth |
| Lower band background | green | The chart background when the price turns up at a lower band. |
| Upper band background | red | The chart background when the price turns down at an upper band. |
Version history
v.1.1.0.0 - October 2026
- Changed: bands 0.5 % / 1 % by default (fit for futures); colours named for what they mark.