ATM Iceberg
v.3.2.0.0 Built on ATM Core Market depth Real time
Overview
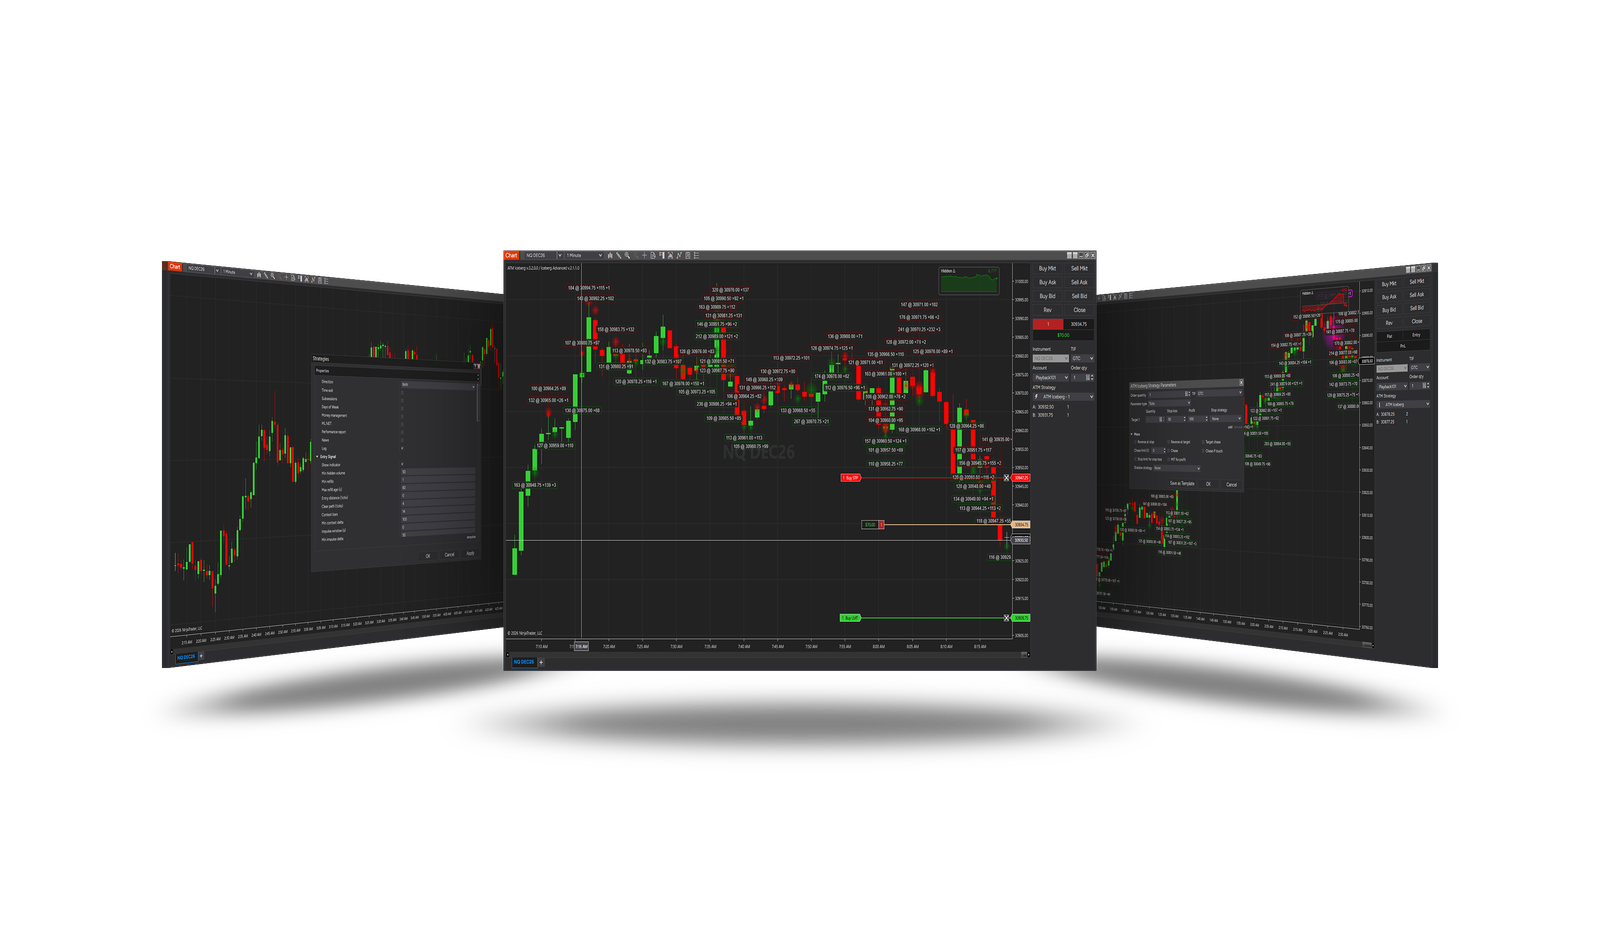
Scalps iceberg walls: a limit order at the price of a working iceberg - a bid iceberg for a long, an ask iceberg for a short - betting that the iceberg holds the price. Stop, target and breakeven come from the ATM template.
How it trades
- The icebergs come from the Iceberg Advanced indicator: refilled recently, with enough hidden volume.
- The price is within Entry distance of the iceberg, no opposite iceberg within Clear path, the hidden delta and the aggressor on the trade's side.
- A limit order at the iceberg; cancelled if the price runs Cancel distance away. One trade per level, a cooldown after each trade.
Parameters
Entry Signal
| Parameter | Default | What it does |
|---|---|---|
| Show indicator | On | Draw the strategy's own copy of Iceberg Advanced on the chart, styled by the Iceberg Indicator group. Leave it off when the chart already carries the indicator. |
| Min hidden volume | 50 | The smallest hidden volume an iceberg needs to count. |
| Min refills | 1 | How many times the iceberg must have refilled to count. |
| Max refill age (s) | 60 | The iceberg's last refill at most this long ago - it is still being defended. |
| Entry distance (ticks) | 0 | How far from the iceberg, on its side, price may be for a signal. |
| Clear path (ticks) | 4 | No opposite iceberg within this many ticks ahead of the trade. 0 = off. |
| Context bars | 14 | The bars the hidden delta is measured over for the context gate. |
| Min context delta | 100 | A hidden delta against the trade vetoes it only beyond this size. |
| Impulse window (s) | 0 | The seconds the aggressor's delta is measured over. 0 = the forming bar. |
| Min impulse delta | 50 | The aggressor's delta on the trade's side at least this large. |
| Cancel distance (ticks) | 10 | Cancel the working limit when price runs this many ticks away from it. |
| Max hold (s) | 90 | Close the ATM at market when its target has not come within this many seconds. 0 = off. |
| Cooldown (s) | 10 | No new signal for this long after a filled trade. 0 = off. |
Iceberg Indicator
| Parameter | Default | What it does |
|---|---|---|
| Draw iceberg info | On | If true, the label chip is drawn next to each iceberg. |
| Draw only volume iceberg | Off | If true, the label shows only the hidden volume instead of volume, price and refill count. |
| Show price shelf | On | If true, a fading line is drawn at the iceberg's price across the bars the level stayed active. |
| Reset hidden delta | On | If true, the Hidden delta plot and panel restart at zero at the start of every Reset period. Display only: the context filter reads a copy of the delta that is never reset. |
| Reset period | Day | How often Hidden delta starts over on the chart: every session (Day), or at the first session of a new week, month or year, counted by trading day. |
| Show hidden delta panel | On | If true, a small readout in the top right corner plots the cumulative hidden delta over the most recent bars. |
| Delta panel bars | 120 | How many of the most recent bars the panel plots. |
| Ask fill color | red | Core colour of the ask-side bloom. |
| Ask outline color | dark red | Ring, shelf and chip border colour on the ask side. |
| Bid fill color | green | Core colour of the bid-side bloom. |
| Bid outline color | dark green | Ring, shelf and chip border colour on the bid side. |
| Draw marker fill | On | If true, the bloom and the core dot are drawn. Turn it off to leave the rings on their own. |
| Draw marker outline | Off | If true, the ring around the bloom is drawn. Turn it off to leave the bloom on its own. |
| Outline width | 1 | Thickness of the ring around the marker, in pixels. A significant iceberg is drawn one pixel heavier than this. |
| Highlight significant | On | If true, the biggest icebergs are drawn in the highlight colour - the levels where enough volume was replenished to be worth watching. |
| Significant threshold (%) | 70 | Share of the largest hidden volume seen so far that an iceberg must reach to be highlighted. |
| Resistance highlight color | magenta | Highlight colour for a significant ask-side iceberg - hidden selling that price has to get through from below. |
| Support highlight color | deep sky blue | Highlight colour for a significant bid-side iceberg - hidden buying that price has to break down through. |
| Circle opacity | 50 | Opacity for the bloom fill (0-100). |
| Label font | Arial 12 | Font for the iceberg label. |
| Label text color | — | Text color for the iceberg label. |
| Min circle radius | 10 | Minimum bloom radius (in pixels). |
| Max circle radius | 50 | Maximum bloom radius (in pixels). |
Core settings
Order handling, position size, stops and targets, trade management, trading hours, account limits and the ML Engine are core settings - the same in every strategy. Hover a group or a core term for a short explanation.
Core defaults
This strategy starts with these core settings; change any of them in its settings.
| Group | Setting | Default |
|---|---|---|
| NinjaTrader | Calculate | On each tick |
| ATM | Template | Iceberg ATM |
| Entry | Order type | Limit |
| Entry | Price from | Strategy |
| Entry | Offset (ticks) | 1 |
| Entry | Lifetime unit | Seconds |
| Entry | Lifetime (s) | 60 |
| Entry | Chase (ticks) | 0 |
| General properties | ML.NET | Off |
| Days of Week (off) | Sunday | On |
| Days of Week (off) | Saturday | On |
| Subsessions (off) | S1 Start | 09:00 |
| Subsessions (off) | S1 End | 16:00 |
| Subsessions (off) | S2 Start | 16:00 |
| Subsessions (off) | S2 End | 00:00 |
| Subsessions (off) | S3 Start | 00:00 |
| Subsessions (off) | S3 End | 09:00 |
Requirements
- Market depth data; real time only - test in Playback on Market Replay with market depth.
Version history
v.3.2.0.0 - October 2026
- Fixed: the age of an iceberg's last refill (Max refill age) is measured against the latest market event - a trade or a change of the book - so it is right in a quiet market too.
Earlier versions
v.3.1.0.0 - October 2026
- Changed: the signal follows NinjaTrader's Calculate setting - On each tick by default, so it is taken inside the bar, the moment it appears.
v.3.0.0.0 - October 2026
- New: ATM Iceberg on the ATM Core.